If you recently completed a facility walk-through, you likely identified a few opportunities for improvement. Here we compile the necessary steps to effectively analyze the scope of your improvement projects.
In a previous blog, we shared how to take advantage of facility downtime to conduct a comprehensive building walk-through. But what happens next? If you recently completed a walk-through, you likely identified a few opportunities for improvement. In this blog, we compile the necessary steps to effectively analyze the scope of your improvement projects, using a facility lighting upgrade as an illustrative example.
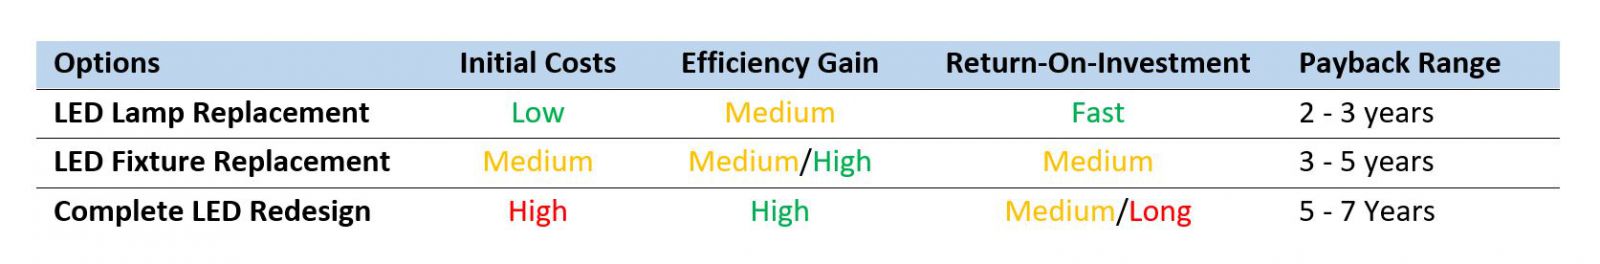
Scoping is an important step in evaluating the impact and prioritization of any facility optimization project. It involves collecting information on the existing system, the proposed new system, calculating savings potential and estimating implementation cost. While every project is different depending on building use, location and local incentives, we offer the following ranges for our lighting upgrade example:
To calculate the return on investment, we need to collect data, calculate savings, and estimate costs. Note that data needed, calculation method, and costs will be different for other conservation opportunities, but the high-level steps are similar to this lighting upgrade analysis.
Step One: Collect the Data
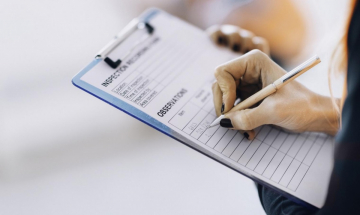
The information collected should be thorough and complete so that when the impact is evaluated it is a true representation of savings. If this step is incomplete, it risks the possibility of undervaluing the savings and may not receive management approval for implementation. However, if estimates are too high or not done correctly, it risks overexaggerating savings that will never be realized when the opportunity is implemented. The following sections will walk through how to collect data appropriately, using this handy data collection form.
For our lighting upgrade example, the information we need to gather includes type of fixtures, fixture specification, number of fixtures in each location, and fixture on hours/annual run time.
Collect Existing Information
Some facilities already have accurate information on the existing lighting whether in lighting schedules, building drawings, or Building Management Systems (BMS). Since you don’t want to do work that has already been done you should first talk with facility managers or maintenance technicians to determine if information on the lighting system already exists. If not, you will need to collect or estimate the information. The easiest way to do this is to separate the building into sections (office, warehouse, manufacturing floor, etc.) and count the types, power (kW), and number of lights (both fixtures and lamps) in those areas.
Make Estimates Where You Need To
Sometimes, it’s difficult to collect all the information you need to complete the project analysis. This is often true when it comes to the run time of lights, as very few facilities have accurate information on the number of hours per year lights in different areas are on. It is very important to account for the difference of run time in different areas instead of assuming one run time for all the lights.
For example, a manufacturing area may run 24 hours per day, 7 days a week while the office lights are only on 10 hours per day, 5 days per week. The difference in run times has a drastic impact on the energy savings calculations. When estimating these run times, and other information, you may not be the best person to make these estimates. Solicit input from those that have the best knowledge of the relevant information and ask for their helping in making estimates.
Step 2: Calculate the Savings
The next step is to use the information you collected to calculate the energy and cost savings. This information along with estimated cost will help determine the viability of a project. There is often more than one way to make these calculations. With our lighting upgrade example, we will walk you through two methods.
Method 1: Lighting Count
The first method is the preferred method and should be used when complete information on the existing lighting is available. Looking at each fixture type you can determine a suitable replacement type, its power and an installed cost. If necessary, enlist the help of a lighting system vendor.
For example, the 2x4 troffer may be replaced with a LED equivalent with 2 lamps, 16W per lamp. Using the information gathered and the site-specific electricity cost you can then determine energy savings.
For an office space that operates 2,500 hours/year, has 75 2x4 troffer fixtures, 2 lamps per fixture, and 32W per lamp, the existing annual energy use is:
32 [W/lamp] x 4 [lamps/fixture] * 75 [fixtures] * 1/1000 [kW/W] * 2,000 [hours/year] = 12,000 [kWh/year].
Replacing the 32W lamp by with 16W LED (50% reduction), reduces the annual usage to 6,000 [kWh/year]. At an average electricity rate of $0.10/kWh, the annual savings is $600.
Method 2: Lighting Power Density
Alternatively, without counting fixtures, the Lighting Power Density (LPD) method provides an adequate, back of the envelope estimate on the potential savings and costs for a lighting project. It will inform whether a more in-depth analysis is needed before moving forward with the lighting upgrade, or the project cost is too high and does not warrant farther efforts.
The LPD method requires determining different sections of the building and their area [ft2], the run times of these areas, and an estimated lighting power density of the areas [kW/ft2]. Different types of areas will have different power densities. For example, a lab space will be much brighter, requiring more power, than a typical manufacturing floor or an office setting.
The next step is to then estimate a potential lighting power reduction that is achievable with a LED lighting upgrade. For a 10,000 square foot office space, the typical base building code lighting power density is 0.8W/square foot.
This translates to 10,000 [sqft] * 0.8 [W/sqft] * 1/1000 [kW/W] * 2,000 [hours/year = 20,000 [kWh/year].
Converting to LED likely reduces the LPD by 50%, resulting in 10,000 [kWh/year] savings. At an average electricity rate of $0.10/kWh, the annual savings is $1,000 per year.
Step 3: Installed Costs
With the annual savings calculated, the last step is to determine the cost. At the beginning, we noted costs for any project can vary. However, using the payback range, we can get an idea of the cost. For example, an LED tube replacement that could save $10,000 per year, the cost would be between $20,000 and $30,000 (2-3 years payback). To be more precise on the cost, vendor quotes are needed.
Watch for our next blog, where we’ll share guidelines for proposal requests, quote evaluation, and project implementation management.
Looking for Facility Optimization Support? Contact us today.